Pie chart example
This example will show you how to create the pie chart below using the Chart macro.
The dataseries
First, we need some data to draw a chart with, this is done with the XmlDataTable macro. You can read the code for that macro in the full example at the end of this article. Once we have the data, we need to bind it to the Chart macro by using the parameter "dataseries". This parameter allows us to bind multiple series to the chart.
| Smartsite SXML |
|
|---|---|
<se:parameter name="dataseries">
    <se:series id="calories" inputdata="mydata" datacolumn="Calories" name="Kilocalories per product" />
    <se:series id="products" inputdata="mydata" datacolumn="Products" />
    <se:series id="exploded" inputdata="mydata" datacolumn="Exploded" />
</se:parameter>
|
|
In this example we have three series, one for each pie chart. The data for each pie is stored in a column in a datatable.
The canvas
Next we define the canvas on which the chart is drawn using the chartcanvas element. The canvas represents the bitmap we are generating and it allows us to set several different options related to the bitmap. There are some obvious parameters like the width, height and fileformat of the bitmap that is generated. The mode3d parameter has been set to true which means that we will see 3d pie charts. Text is rendered in antialias mode for smooth text. The bitmap has two borders, an inner border and a outer border.
| Smartsite SXML |
|
|---|---|
<se:parameter name="layout">
    <se:chartcanvas fileformat="png" width="800" height="600" mode3d="true" textrenderingmode="antialias">
        <se:fill mode="gradient" color1="white" color2="#e0e0e0" gradientstyle="horizontal" gradientvariant="variant1" />
        <se:outerborder width="5" color="#e0e0e0" />
        <se:innerborder width="5" color="#f0f0f0" />
        ...
    </se:chartcanvas>
</se:parameter>
|
|
The legends
This example has three different legends defined. Each legend shown in the chart can have a different markup and location. The first two legends only have a different header text and location. The third legend has two columns and uses a dotted line to separate the datapoints in the legend.
| Smartsite SXML |
|
|---|---|
<se:legend id="firstlegend" x="720" y="20" anchor="bottomleft">
    <se:header text="First Legend">
        <se:font style="bold" />
    </se:header>
</se:legend>

<se:legend id="secondlegend" x="720" y="220" anchor="bottomleft">
    <se:header text="Second Legend">
        <se:font style="bold" />
    </se:header>
</se:legend>

<se:legend id="thirdlegend" x="720" y="420" anchor="bottomleft" maxcols="2">
    <se:header text="Third Legend">
        <se:font style="bold" />
    </se:header>
    <se:horizontalline width="1" pattern="dash" />
    <se:verticalline width="1" pattern="dash" />
</se:legend>
|
|
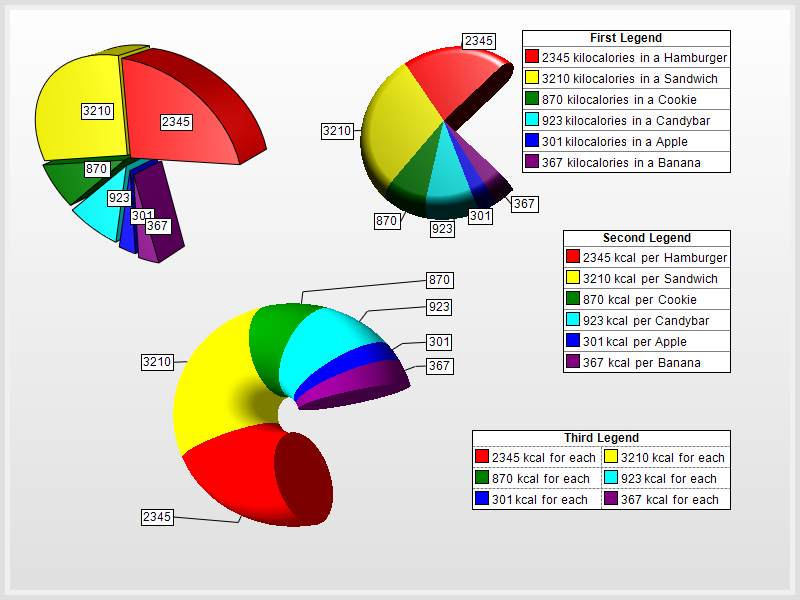
The first pie
In the first chart is the pie chart in the upper left corner. Inside this pie chart the elements "projection", "lighting" and "pie" are defined. The element "projection" defines under which angle you look at the pie chart. This element allows you to perform 3d transformations to the pie chart. The second element defines how the lighting on the 3d pie is done. The element "pie" defines the pie with exploded pieces. The pie has a total angle of 270 degrees.
| Smartsite SXML |
|
|---|---|
<se:piechart x="20" y="20" width="250" height="250">
<se:projection predefined="perspectivetilted" />
<se:lighting predefined="northernlights" />
<se:pie values="calories" exploded="exploded" labels="products" totalangle="270" beginangle="15" style="pie" labelmode="center">
<se:serieslegend ref="firstlegend" mode="datapoints" format="<value> kilocalories in a <label>" />
<se:datapoints>
<se:datalabel />
</se:datapoints>
<se:datapoints match="1">
<se:fill color1="red" />
</se:datapoints>
<se:datapoints match="2">
<se:fill color1="yellow" />
</se:datapoints>
<se:datapoints match="3">
<se:fill color1="green" />
</se:datapoints>
<se:datapoints match="4">
<se:fill color1="cyan" />
</se:datapoints>
<se:datapoints match="5">
<se:fill color1="blue" />
</se:datapoints>
<se:datapoints match="6">
<se:fill color1="purple" />
</se:datapoints>
</se:pie>
</se:piechart>
|
|
The element "serieslegend" defines that the datapoints from this pie chart should be listed in the legend with the id "firstlegend". The datapoints define the colors for each datapoint of the pie.
Second pie
The second pie is the pie chart in the upper right corner. Its projection is slightly different from the first pie because it is rotated and elevated compared to the first pie. Its lighting has been set to "metalliclustre". The pie is defined as a "smoothedgepie" which shows because the pie has rounded corners compared to the first pie chart. The labelmode "rim" means that there is a line between the pie part and its datalabel.
| Smartsite SXML |
|
|---|---|
<se:piechart x="320" y="0" width="250" height="250">
<se:projection predefined="perspective" rotation="0" viewerrotation="30" elevation="-30" />
<se:lighting predefined="metalliclustre" />
<se:pie values="calories" labels="products" totalangle="270" beginangle="15" style="smoothedgepie" labelmode="rim" pieedge="100">
<se:serieslegend ref="secondlegend" mode="datapoints" format="<value> kcal per <label>" />
<se:datapoints>
<se:datalabel />
</se:datapoints>
<se:datapoints match="1">
<se:fill color1="red" />
</se:datapoints>
<se:datapoints match="2">
<se:fill color1="yellow" />
</se:datapoints>
<se:datapoints match="3">
<se:fill color1="green" />
</se:datapoints>
<se:datapoints match="4">
<se:fill color1="cyan" />
</se:datapoints>
<se:datapoints match="5">
<se:fill color1="blue" />
</se:datapoints>
<se:datapoints match="6">
<se:fill color1="purple" />
</se:datapoints>
</se:pie>
</se:piechart>
|
|
Third pie
The third pie is in fact a donut. This is achieved by setting the innter radius to 20 pixels. The clockwise attribute defines that the pie parts are in the reverse order compared to the other two pie charts. The labelmode "spider" result in a line consisting the two line segments from the pie part to the label.
| Smartsite SXML |
|
|---|---|
<se:piechart x="160" y="280" width="250" height="250">
<se:projection predefined="perspectiverotated" />
<se:lighting predefined="softtopright" />
<se:pie values="calories" totalangle="270" beginangle="15" style="torus" labelmode="spider" innerradius="20" clockwise="true">
<se:serieslegend ref="ThirdLegend" mode="datapoints" format="<value> kcal for each <label>" />
<se:datapoints>
<se:datalabel />
</se:datapoints>
<se:datapoints match="1">
<se:fill color1="red" />
</se:datapoints>
<se:datapoints match="2">
<se:fill color1="yellow" />
</se:datapoints>
<se:datapoints match="3">
<se:fill color1="green" />
</se:datapoints>
<se:datapoints match="4">
<se:fill color1="cyan" />
</se:datapoints>
<se:datapoints match="5">
<se:fill color1="blue" />
</se:datapoints>
<se:datapoints match="6">
<se:fill color1="purple" />
</se:datapoints>
</se:pie>
</se:piechart>
|
|
Complete listing
This is the complete listing of the code:
| Smartsite SXML |
|
|---|---|
<se:xmldatatable save="mydata" resulttype="datatable">
<se:row>
<se:col name="Calories" datatype="integer">2345</se:col>
<se:col name="Products" datatype="string">Hamburger</se:col>
<se:col name="Exploded" datatype="float">0</se:col>
</se:row>
<se:row>
<se:col>3210</se:col>
<se:col>Sandwich</se:col>
<se:col>1</se:col>
</se:row>
<se:row>
<se:col>870</se:col>
<se:col>Cookie</se:col>
<se:col>2</se:col>
</se:row>
<se:row>
<se:col>923</se:col>
<se:col>Candybar</se:col>
<se:col>3</se:col>
</se:row>
<se:row>
<se:col>301</se:col>
<se:col>Apple</se:col>
<se:col>4</se:col>
</se:row>
<se:row>
<se:col>367</se:col>
<se:col>Banana</se:col>
<se:col>5</se:col>
</se:row>
</se:xmldatatable>
<se:chart>
<se:parameters>
<se:parameter name="dataseries">
<se:series id="calories" inputdata="mydata" datacolumn="Calories" name="Kilocalories per product" />
<se:series id="products" inputdata="mydata" datacolumn="Products" />
<se:series id="exploded" inputdata="mydata" datacolumn="Exploded" />
</se:parameter>
<se:parameter name="layout">
<se:chartcanvas fileformat="png" width="800" height="600" mode3d="true" textrenderingmode="antialias">
<se:fill mode="gradient" color1="white" color2="#e0e0e0" gradientstyle="horizontal" gradientvariant="variant1" />
<se:outerborder width="5" color="#e0e0e0" />
<se:innerborder width="5" color="#f0f0f0" />
<se:legend id="firstlegend" x="720" y="20" anchor="bottomleft">
<se:header text="First Legend">
<se:font style="bold" />
</se:header>
</se:legend>
<se:legend id="secondlegend" x="720" y="220" anchor="bottomleft">
<se:header text="Second Legend">
<se:font style="bold" />
</se:header>
</se:legend>
<se:legend id="thirdlegend" x="720" y="420" anchor="bottomleft" maxcols="2">
<se:header text="Third Legend">
<se:font style="bold" />
</se:header>
<se:horizontalline width="1" pattern="dash" />
<se:verticalline width="1" pattern="dash" />
</se:legend>
<se:piechart x="20" y="20" width="250" height="250">
<se:projection predefined="perspectivetilted" />
<se:lighting predefined="northernlights" />
<se:pie values="calories" exploded="exploded" labels="products" totalangle="270" beginangle="15" style="pie" labelmode="center">
<se:serieslegend ref="firstlegend" mode="datapoints" format="<value> kilocalories in a <label>" />
<se:datapoints>
<se:datalabel />
</se:datapoints>
<se:datapoints match="1">
<se:fill color1="red" />
</se:datapoints>
<se:datapoints match="2">
<se:fill color1="yellow" />
</se:datapoints>
<se:datapoints match="3">
<se:fill color1="green" />
</se:datapoints>
<se:datapoints match="4">
<se:fill color1="cyan" />
</se:datapoints>
<se:datapoints match="5">
<se:fill color1="blue" />
</se:datapoints>
<se:datapoints match="6">
<se:fill color1="purple" />
</se:datapoints>
</se:pie>
</se:piechart>
<se:piechart x="320" y="0" width="250" height="250">
<se:projection predefined="perspective" rotation="0" viewerrotation="30" elevation="-30" />
<se:lighting predefined="metalliclustre" />
<se:pie values="calories" labels="products" totalangle="270" beginangle="15" style="smoothedgepie" labelmode="rim" pieedge="100">
<se:serieslegend ref="secondlegend" mode="datapoints" format="<value> kcal per <label>" />
<se:datapoints>
<se:datalabel />
</se:datapoints>
<se:datapoints match="1">
<se:fill color1="red" />
</se:datapoints>
<se:datapoints match="2">
<se:fill color1="yellow" />
</se:datapoints>
<se:datapoints match="3">
<se:fill color1="green" />
</se:datapoints>
<se:datapoints match="4">
<se:fill color1="cyan" />
</se:datapoints>
<se:datapoints match="5">
<se:fill color1="blue" />
</se:datapoints>
<se:datapoints match="6">
<se:fill color1="purple" />
</se:datapoints>
</se:pie>
</se:piechart>
<se:piechart x="160" y="280" width="250" height="250">
<se:projection predefined="perspectiverotated" />
<se:lighting predefined="softtopright" />
<se:pie values="calories" totalangle="270" beginangle="15" style="torus" labelmode="spider" innerradius="20" clockwise="true">
<se:serieslegend ref="ThirdLegend" mode="datapoints" format="<value> kcal for each <label>" />
<se:datapoints>
<se:datalabel />
</se:datapoints>
<se:datapoints match="1">
<se:fill color1="red" />
</se:datapoints>
<se:datapoints match="2">
<se:fill color1="yellow" />
</se:datapoints>
<se:datapoints match="3">
<se:fill color1="green" />
</se:datapoints>
<se:datapoints match="4">
<se:fill color1="cyan" />
</se:datapoints>
<se:datapoints match="5">
<se:fill color1="blue" />
</se:datapoints>
<se:datapoints match="6">
<se:fill color1="purple" />
</se:datapoints>
</se:pie>
</se:piechart>
</se:chartcanvas>
</se:parameter>
</se:parameters>
</se:chart>
|
|
| Smartsite SXML |
|
|---|---|